2023 Excess Mortality Positively Associated With COVID Vaccination Rates
Comparison of Countries
SUMMARY: The baffling pattern of positive association of excess mortality with COVID vaccination rates continued in 2023, contradicting the thesis that “COVID vaccines save lives.” It is statistically significant and is unlikely to have occurred by chance. It continued the patterns seen in 2022.
In 2022, I wrote a series of posts discussing the correlation of excess mortality with vaccination rates. Several comparisons by country, German-Bundesland, and more showed a positive relationship between excess mortality and vaccination (or booster) rates.
That would be impossible if “Covid vaccines saved lives.” The real-world data bafflingly suggests that Covid vaccines increase excess mortality instead of decreasing it.
Back then, I expressed a hope that excess mortality would moderate, a hope based on my wishing the best for all vaccinated people.
It is January 2024. Therefore, we can ask, what happened in 2023?
2023 Update
I found more data and re-analyzed it. There is good and bad news regarding the relationship between excess mortality and vaccination rates.
Let’s take a look.
I found excess mortality for weeks 1-40 of 2023 on the OECD website.
I pulled total Covid vaccination rates from Our World in Data.
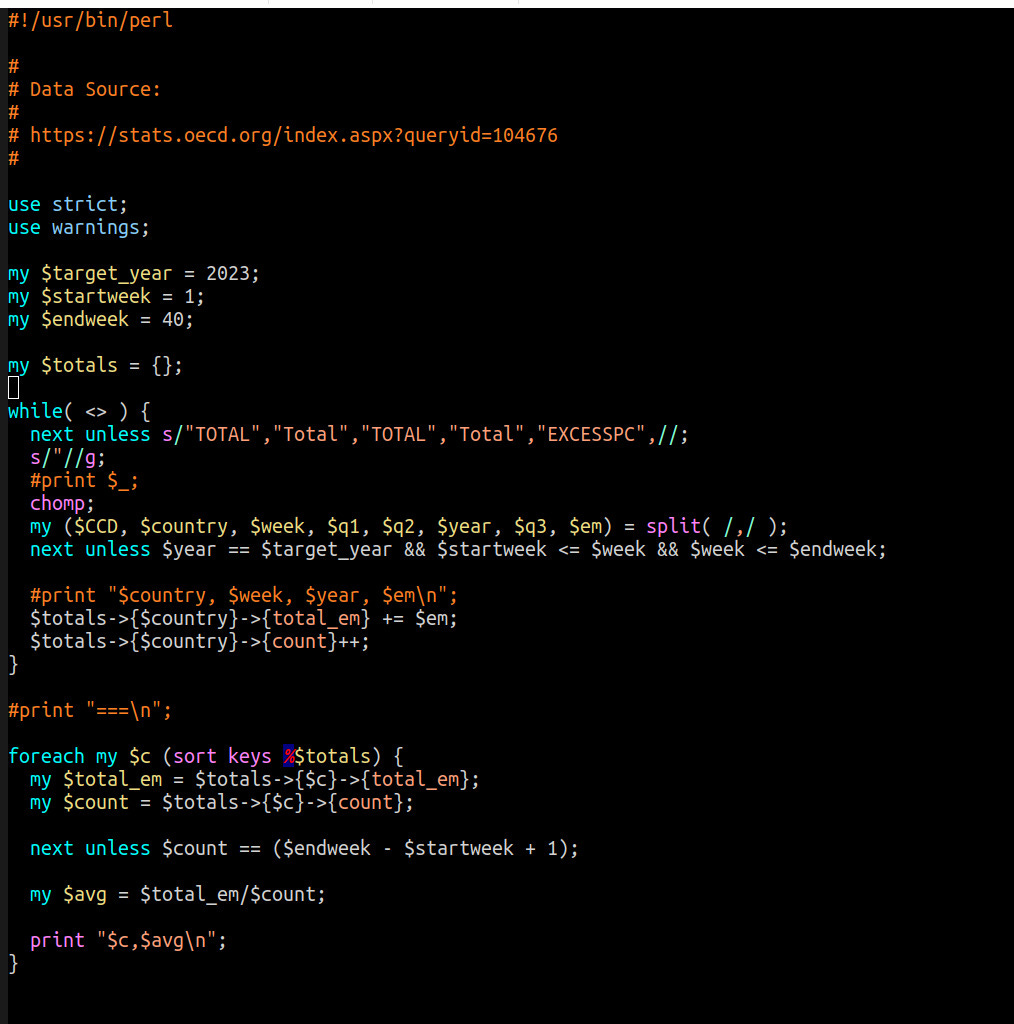
To calculate average mortality from weekly OECD data, I wrote this Perl script to load the CSV data and average it, limiting myself to countries with a full 40 weeks of data.
Please note that averaging “weekly excess mortality” for weeks 1-40 is not a perfectly correct calculation for the excess mortality in that period (fact checkers, take note!), but it is a very close approximation.
Additionally, I excluded Israel due to the armed conflict that occurred during this period.
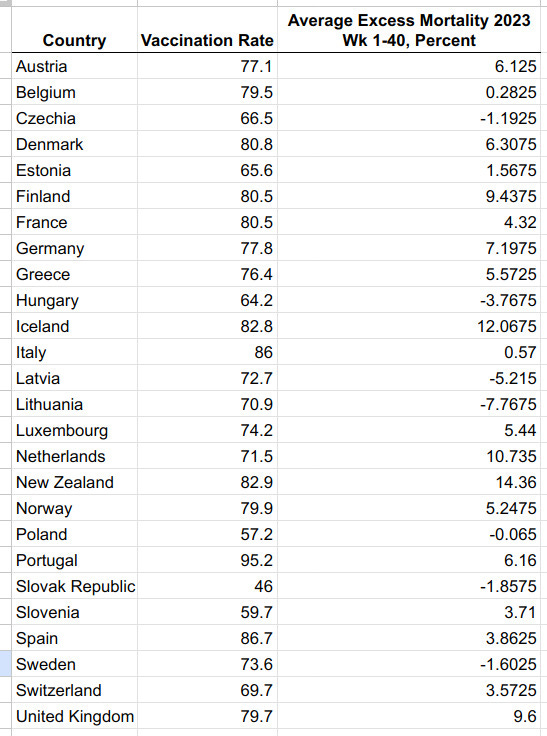
Here’s the data:
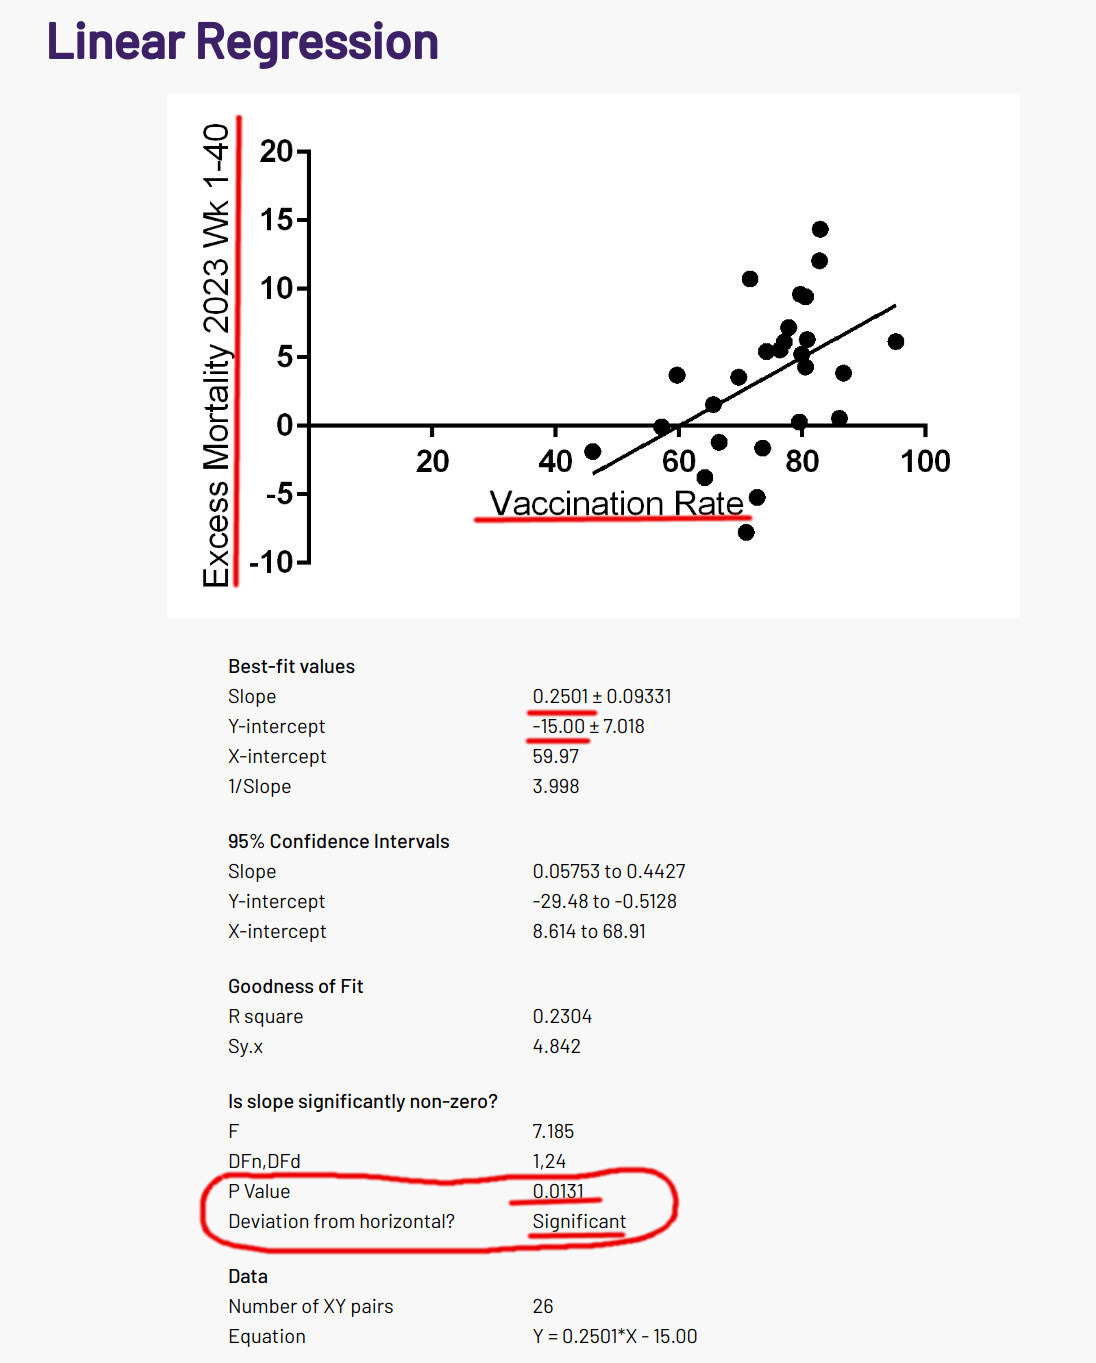
Here’s the dot-plot visualization:
How significant is this association? I used GraphPad linear regression calculator to analyze the numbers:
It turns out that COVID-19 vaccination rates increase mortality by 25.01%, and the association is highly statistically significant with the P-value of 0.0131, showing that it is unlikely a result of random chance.
Bad News
We were told that “Covid vaccines save lives.” The real-world data, unfortunately, shows the opposite. The pattern seen in previous analyses continues: vaccination rates are associated with increases, not decreases, in total mortality.
Similarities between relationships between vaccination rates and excess mortality in 2023 and 2022 (2022 data discussed here) are striking:
Good News
I have good news for people tired of negativity: excess mortality during weeks 1-40 of 2023 was somewhat lower than in 2022. Could it be explained by people no longer vaccinating against COVID-19? We cannot be sure of the answer based on the data above, but we cannot dismiss that explanation either.
Consider Upgrading Your Subscription
I am deeply grateful to my paid subscribers, who sustain my efforts. Paid subscribers get no benefit: no paid-only articles, paid-only commenting, etc. They support me only because of the goodness of their hearts.
I do not sell supplements or have any conflicts of interest. My only interest is writing truthful posts that may engage my readers. Writing articles like this one takes considerable effort, computer programming, etc. Therefore, please consider upgrading to a paid subscription:
Thank you!
Share Your Thoughts!
Your thoughts and predictions on excess mortality will be greatly appreciated, so please comment on this post:
What is the biological reason for such a positive association?
How come Covid vaccinations, which mainly occurred in 2021, still affect excess mortality two years later?
Can this data be reanalyzed using, for example, booster rates or doses in 2023, as the independent variable?
Will this get better or worse?


The jabs kill in two ways - the first is by causing a major reaction from the victim that results in the short term death. The second is by causing cumulative damage that results in some form of permanent cardio-vascular or neurological condition that, sadly, results in a slower death. The slight decrease in the death rate is what I expected as there are fewer and fewer imbeciles taking up the jabs (hence the tanking stock price for Murderna). What the data confirms is the slow moving train wreck that both the governments and medical community are trying very hard to ignore in the hope that it all goes away. If you want more proof that the jabs were toxic, the very fact that they rule the jabs out tells me that they know damn well what they would find IF they were to investigate toxic shots. Remember, vaccines in the past were stopped with only a handful of deaths - this time they had evidence of thousands of deaths and they doubled down by making them compulsory to earn a living. That is mass-murder pure and simple and no analysis will ever show anything different. Facts are facts. So far, they have managed to get away with the biggest crime probably in human history.
Yes. The vax finally killed my UK friend of 51 years. Took three years to do the job on her. Destroyed every enjoyment of life until her body gave out Friday night. You don't want to know how much I hate those people. All we can hope for is justice, here or elsewhere.