
Is Santa Clara County, CA breakthrough data fake?

A few of my associates live in sunny Santa Clara County, California. They always send me links to Santa Clara County case rates by vaccination status, that prove that “vaccination works”. I actually keep a spreadsheet for breakthrough rates, with a part dedicated to Santa Clara County data, just to keep an eye on it.
We are all driven by the Covid data, this is the new sciencey way, and the data should guide our decisions. This is what Dr Fauci is telling us, helpfully providing the “data” to support his ever changing pronouncements. And indeed, the “data” from SCC is nothing short of miraculous, showing that vaccines in Santa Clara County work stunningly well, so much better than, say, in the UK, or in many other locations that we will explore. As the US and the world descend into “worldwide vaccine failure”, SCC continues to delight us with ever increasing “vaccine good news”.
The problem is that Santa Clara’s data is very possibly fake, or at least contains unexplained inconsistencies, does not match its neighbors, and changes retroactively going months back.
I took screenshots of their graphs, photos separated by just two days. I have larger pictures of my computer screen if anyone doubts veracity of this.
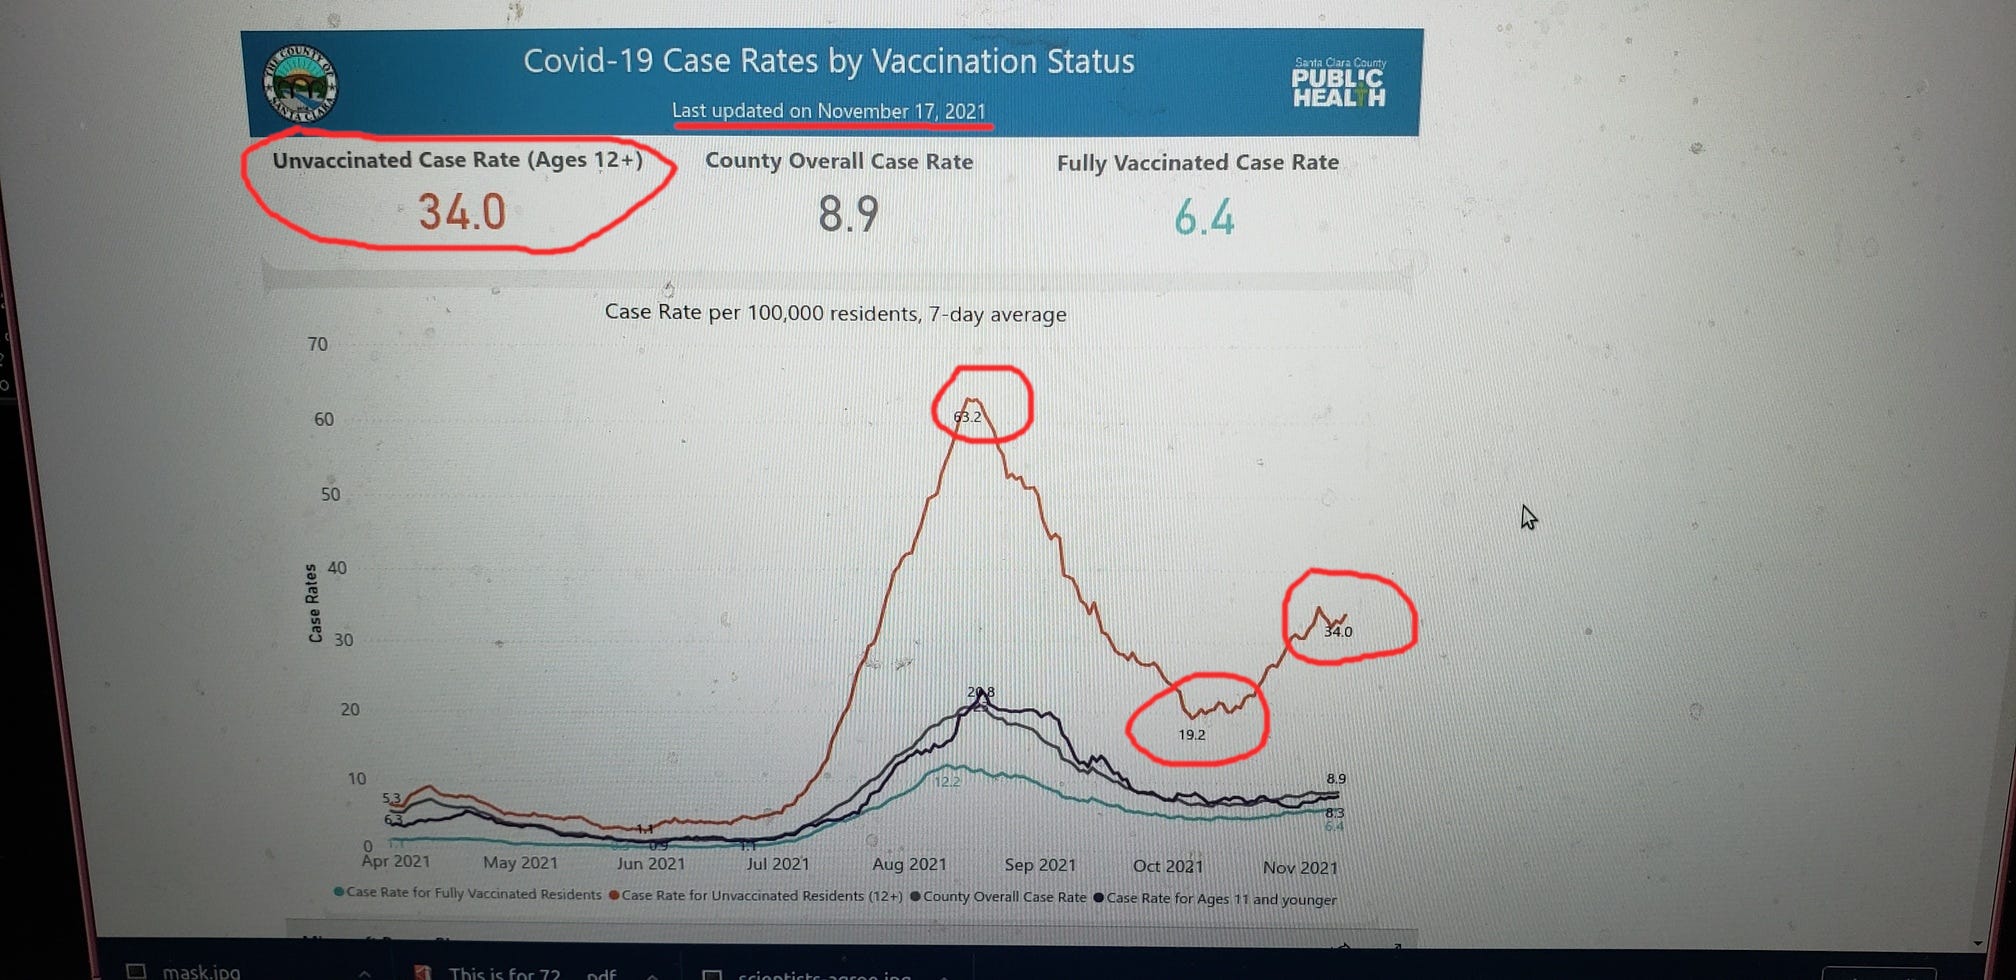
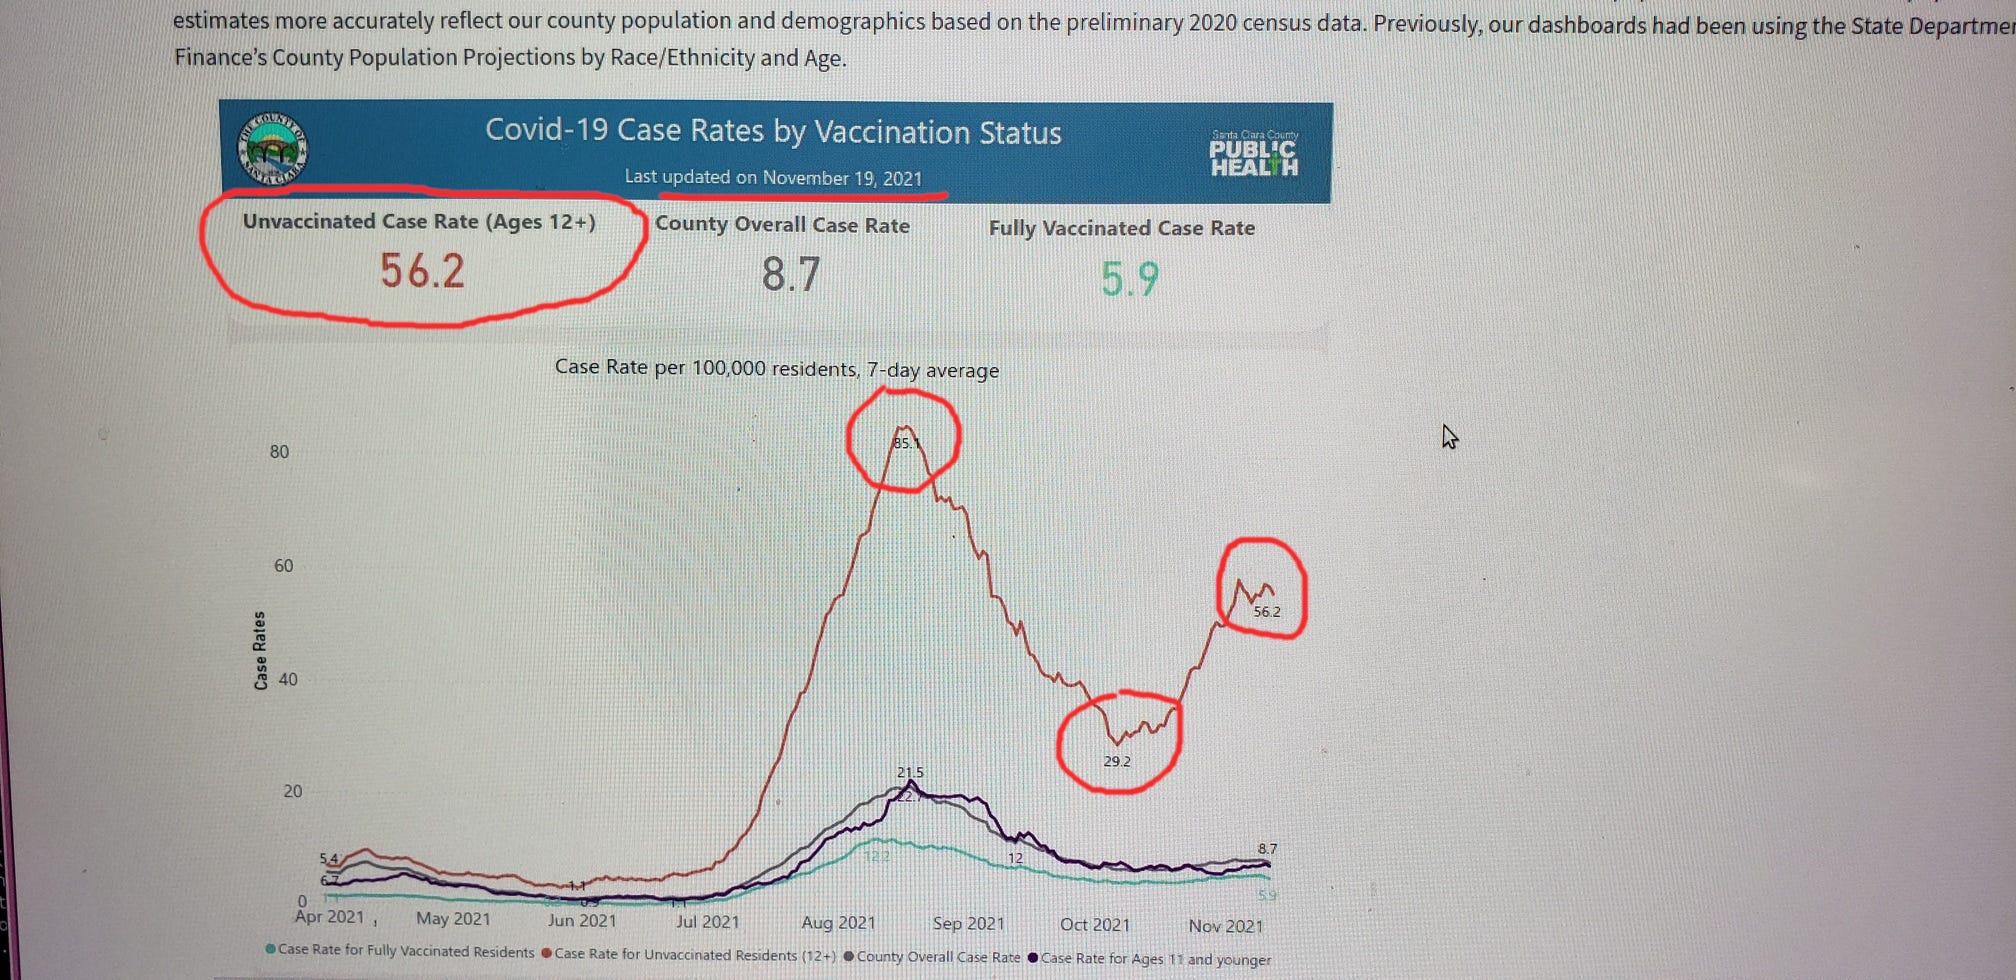
The first two graphs are my cell phone pictures of the same page as of Nov 17 2021, and Nov 19 2021. (I have cell phone photos of my whole desktop just in case)
Superficially they look similar, but they are anything but. The unvaccinated case rate curve suddenly increased up to 60% in some places, going way back into the past. For example, the peak of Aug 2021 used to be 63 cases per 100,000, and now it is 85 cases per 100,000. Mind you, this is for the graph as of November. Why change August data? The recently reported (Nov 17) unvaxxed rate of 34 cases per 100,000 became suddenly 56 cases per 100,000 as of Nov 19. A stunning retroactive 64% change in rate in just two days!
I also keep a table in a private spreadsheet, having weekly data going back to Apr 2021. I saved unvaccinated, vaccinated and total case rates. I understand that this data, having been saved by me, is less of evidentiary proof than recent screen captures, and you would have to believe me and my honesty when I cite it. I would understand if a random reader of this blog would choose not to believe me. No hard feelings. But I will keep going.
The data in my spreadsheet completely disagrees with the recent revisions of unvaccinated case rate graph. For example, the yesterday official graph says that unvaccinated case rate was 85.1 on Aug 17, 2021. The three days ago official graph (pictured above) says that the rate was 63 on the same date. My own spreadsheet with data saved as of Aug 18, 2021, says that the unvaccinated rate was THEN reported as 32.3 per 100,000.
What?
These Santa Clara County graphs keep changing retroactively, going way into the past.
The more time passes, the more they “improve” and the worse the unvaccinated case rates look, projected many months into the past.
My own, recorded data from my spreadsheet is here. It was recorded as it was reported. Click on it to expand:

Unfortunately, SCC uses “Powerbigov” applet to display data and archive.org does not show previous versions of the graph. But it is clear that some serious hanky panky is going on.
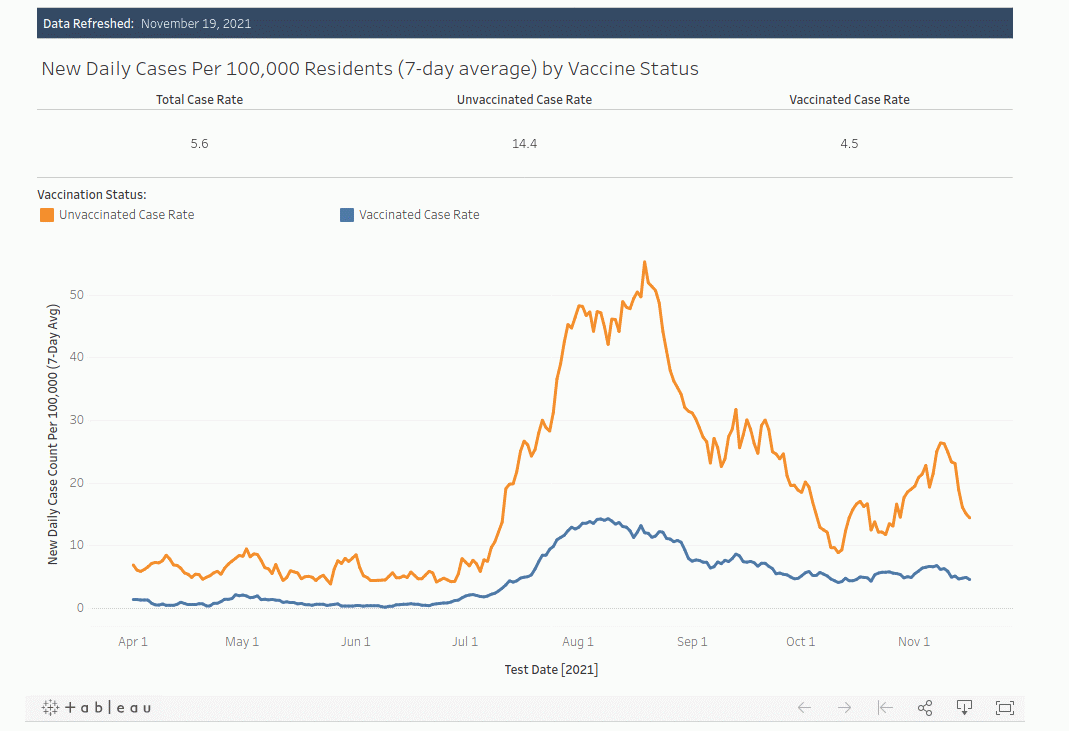
Comparing with Marin County
Marin County is next to Santa Clara County and is similar to SCC in many ways, such as vaccination rate, weather, political affiliations, and so on. Infections rates in Marin County are extremely different from Santa Clara county despite their similarities:
On Nov 8, 2021: Marin county unvaxxed case rate 26, Santa Clara County unvaxxed rate 55.9. Oddly enough, vaccinated case rates are reported about equal as 5.9 and 6.1.
Looking into the past Aug 17: Santa Clara County reports 85 per 100,000 among unvaxxed, Marin County reports only 49 per 100,000. Again, rates among the vaxxed about equal.
You can also note that the recent ratio of unvaxxed/vaxxed case rates for neighboring Marin County is about 4:1 to 3:1, while Santa Clara county is 9:1 or so. Are the unvaccinated persons in SCC especially egregiously ignorant compared to Marin County? Or that an artifact of data fudging?
Comparing with Oregon
Oregon neighbors California and also reports breakthrough cases. Per Oregon,
The rate of COVID-19 cases among unvaccinated individuals in the most recent week was more than 4.5 times the rate of COVID-19 cases among those who are fully vaccinated
The comparison of the same unvaxxed/vaxxed rate ratio between Oregon (4.5) and SCC (about 9.5 recently) shows that SCC’s vaccines are somehow over twice as effective. Because of what?
What could explain this?
It is not really my job to make guesses as to why Santa Clara County’s data is changing retroactively so strangely to favor vaccination and why it is so wildly different from its neighbors. My best uneducated guess is that they use incorrect estimates of unvaccinated population.
They also could be counting infections in double vaxxed people due for booster as unvaccinated cases, while using count of “unvaccinated people” as the denominator. This would explain quite a bit of changes. But it could be anything really. I do suspect that these misstatements are intentional and driven by politics.
I also cannot say what the “true” numbers would be if they were honestly reported.
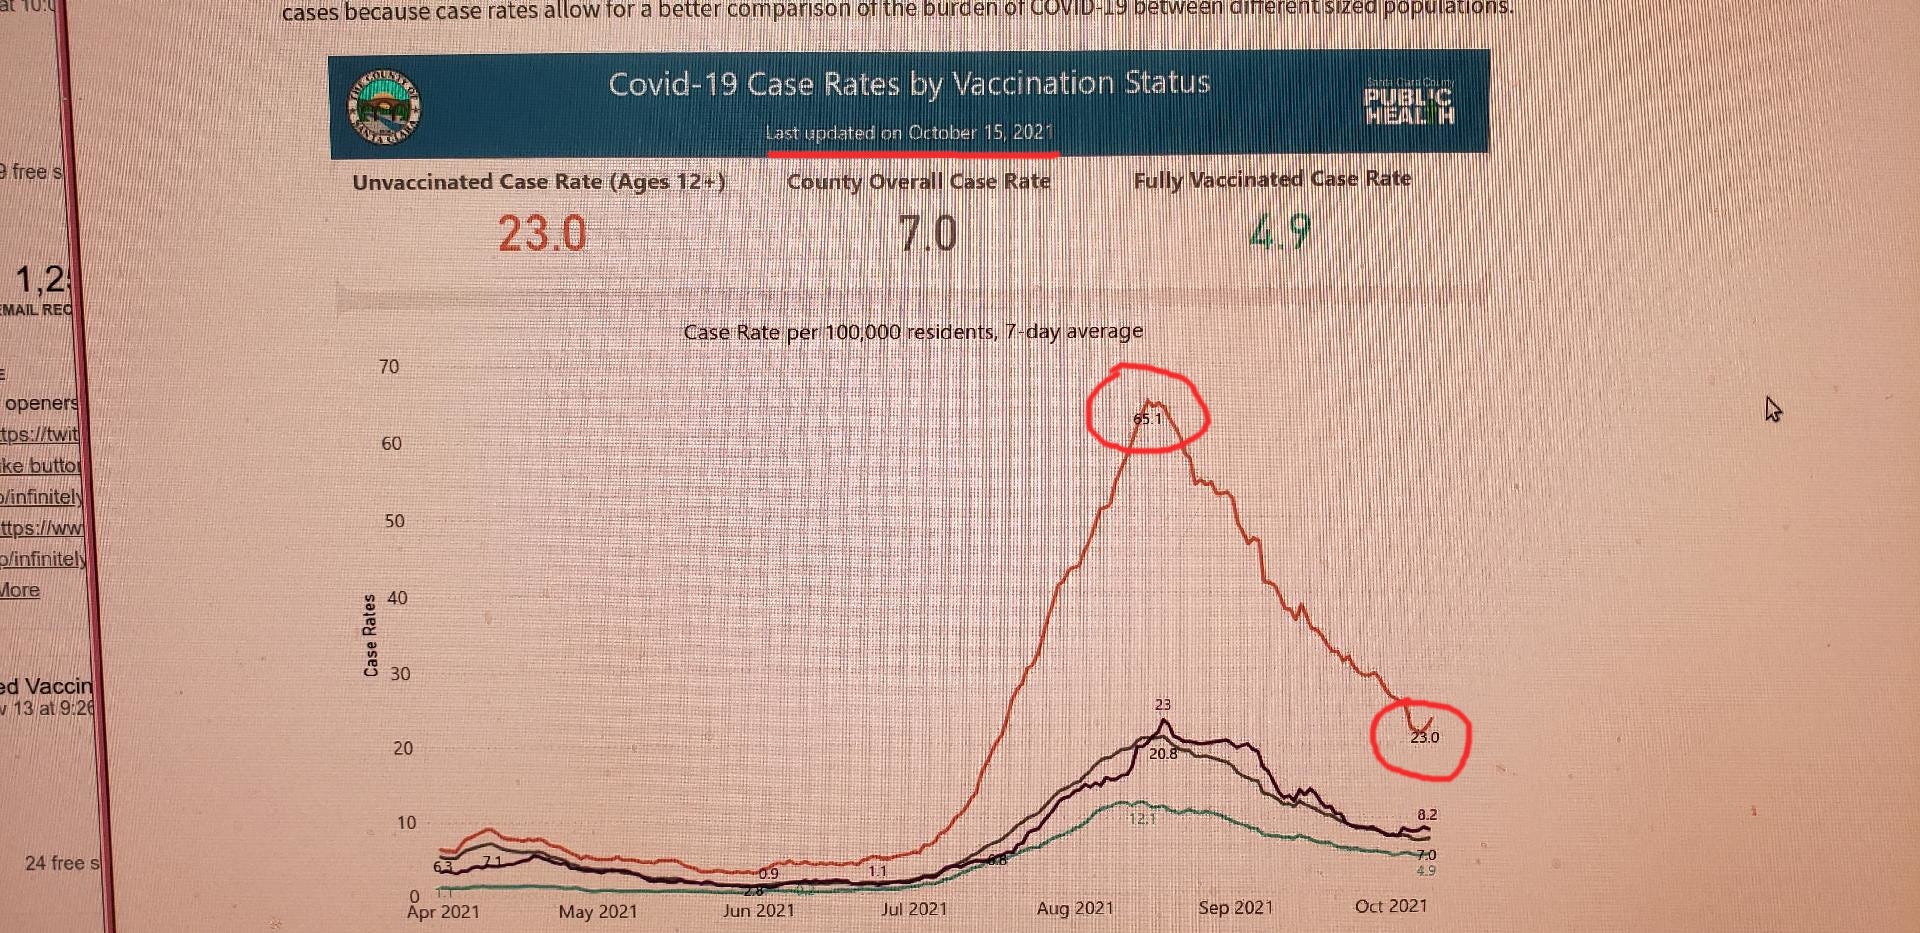
What was the unvaxxed rate around Aug 18: 34, 63, or 85 per 100,000, as SCC reported at various times? Was even one of these numbers truthful? We will probably never know for sure.
I Sent a message to Santa Clara County reporting “inaccurate information”:
Dear Santa Clara County,

Some authors on the Internet are bringing our attention to inaccurate case rate graphs on your "Case Rates by Vaccinated Status Dashboard".

Specifically, one author prints snapshots of your graphs and shows how you retroactively change values for many months ago. They even call your data fake.

Please respond to this and explain why is your data changing. For example, why was the unvaxxed case rate for Aug 17-18 reported as 34 per 100,000 originally, several months later became 63 per 100,000, and two days following that became 85 per 100,000?

Anxious Internet users are awaiting your reply. Thank you!

Igor Chudov
Thank you so much for following and exposing these Criminals.
It wouldn’t surprise me if they have already started counting people who haven’t had the booster as unvaccinated for the 11/17 vs 11/19 count. SCC is pushing the third shot hard. It’s crazy here.